
HFM Performance Tuning: MaxDataCacheSize and MaxNumCubesInRAM Explained
If you've spent time in Oracle Hyperion Financial Management's Consolidation Administration settings, you've probably come across two values that live right next to each other: MaxDataCacheSize and MaxNumCubesInRAM. They look like two separate knobs. In practice, they're two ceilings on the same mechanism, and tuning one without the other is a common way to "fix" a performance problem that doesn't actually go away.
What each setting actually governs
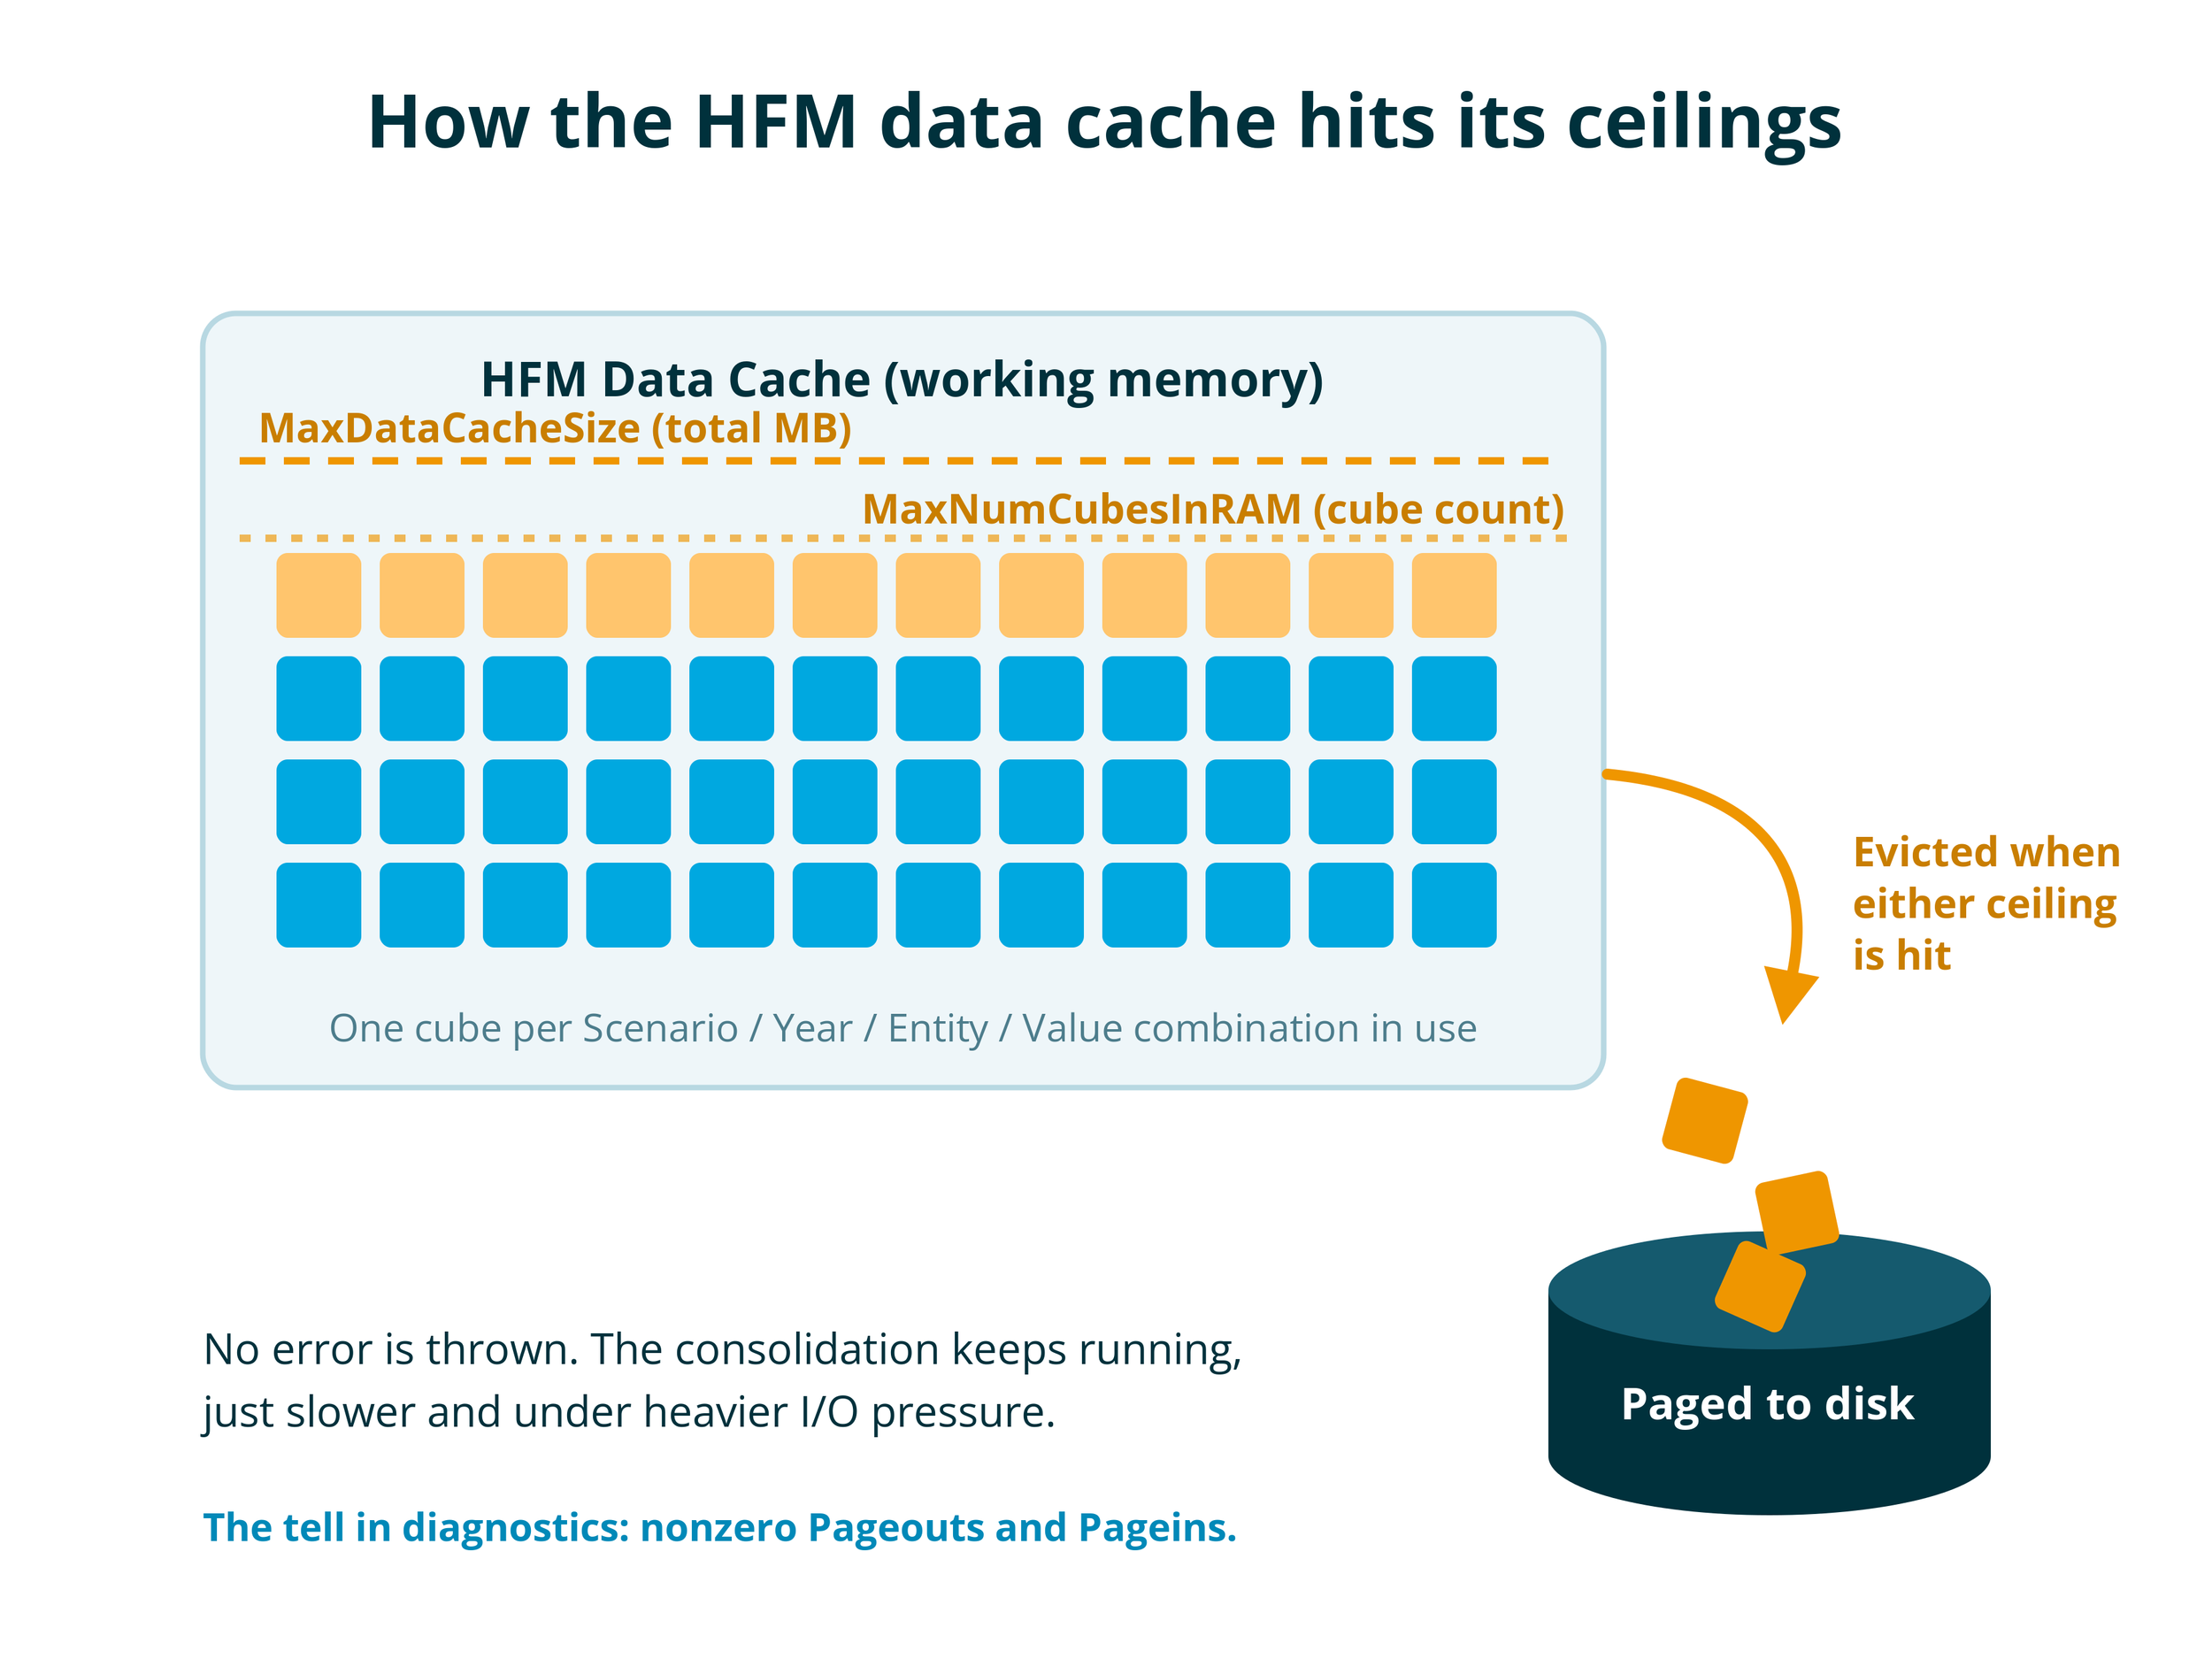
HFM stores working data in memory as individual data cubes, roughly one cube per unique combination of Scenario, Year, Entity, and Value dimension member that the application needs to hold in RAM at a given moment. During something like a large consolidation, the number of these combinations touched can be substantial, especially at a top-of-house entity where translation, elimination, and cumulative calculations may need to reference many descendants across multiple periods.
MaxDataCacheSize caps the total memory, in megabytes, that this data cache is allowed to consume.
MaxNumCubesInRAM caps the total count of individual cubes that can be held in memory at once, regardless of how much memory each cube actually uses.
These are independent limits on the same pool of working data. HFM will hit whichever ceiling comes first, and the behavior when it does is the same either way: cubes that don't fit get pushed out of memory and paged to disk to make room for new ones.
Why this matters for large consolidations specifically
Smaller consolidations rarely touch enough distinct entity/scenario/year combinations to come close to either limit, so these settings can sit at their default values for years without anyone noticing. A full top-of-house consolidation is a different story. It can pull in far more cubes and far more raw data volume than any subsidiary run, which is exactly the kind of workload that exposes an undersized cache setting that's gone unnoticed on smaller jobs.
The tricky part is that hitting one of these ceilings doesn't produce a clean error. HFM doesn't crash or throw an out-of-memory exception. It quietly starts evicting and paging cubes to disk, and the consolidation keeps running, just slower, and under more I/O pressure than expected. That degradation can eventually manifest downstream in unexpected ways, including things that look unrelated to caching at first glance, like a database fetch operation stalling or timing out because the surrounding system is under sustained load.
How to actually check whether you're hitting these limits
HFM exposes cache diagnostics that make this straightforward to verify rather than guess at. The key figures to pull for a given run:
Num Cubes and Max cubes in cache, compared against your configured MaxNumCubesInRAM
Pageouts and Pageins, the real tell for cache pressure
Cube changes, how much churn the cache experienced during the run
Max cells cached and Last cells cached, relative to overall cache capacity
If Pageouts and Pageins both come back at zero, and your cube count is well under the configured ceiling, the cache was never under pressure during that run, full stop. That's a clean, evidence-based way to rule the cache settings out as a cause, rather than assuming they're the problem just because a large job is running slowly. It's worth checking this before spending time tuning either value, since raising numbers that were never actually constraining anything won't move the needle on the real issue.
If instead you see nonzero pageouts and a cube count sitting right at the ceiling, that's confirmation the setting is actively limiting your run, and it's a legitimate target for tuning.
Tuning the two settings together
If diagnostics do point to cache pressure, the two settings need to move together, not in isolation. Here's why: raising MaxDataCacheSize alone gives the cache more memory headroom, but if MaxNumCubesInRAM is the tighter constraint for your workload, you'll hit the cube-count ceiling first and see the exact same paging behavior, just triggered by a different limit. You'd end up concluding the memory increase "didn't help," when really you just moved the bottleneck without addressing it.
A reasonable practical approach:
Pull cache diagnostics from an actual large consolidation run to get real numbers, not estimates
Estimate how many entity/scenario/year combinations the largest consolidation in your environment realistically touches, and compare that against the current MaxNumCubesInRAM
Check available server RAM against the current MaxDataCacheSize. It's common to find a cache setting that was reasonable years ago sitting well under what current hardware could comfortably support
Increase both settings proportionally when testing, so you're not isolating one variable while leaving the other as an unexamined constraint
Test in a non-production environment first if possible, and plan for an application restart, since these settings don't take effect until the application service is bounced
The bigger lesson
These two settings are easy to treat as generic "make it bigger" tuning parameters, but they're worth approaching as a diagnostic question first: is the cache the bottleneck, or does it just look that way because a large job happens to be slow? HFM's built-in cache statistics answer that question directly, with real pageout and cube-count numbers instead of guesswork. Ruling a cause out with data is just as valuable as confirming one, and it keeps you from spending a maintenance window changing settings that were never actually the problem.
If you've pulled your diagnostics and the picture still isn't clear, we're glad to take a look. Schedule a discovery call and we'll help you sort out what your environment is telling you.